Resources associated with one beef animal
Use the selector to move between one animal, one kilogram of carcass and a 150 g edible portion.
≈625 kg live weight · ≈369 kg carcass
Ismea 2025 proxy; not an Italian national average.
MapTheFood estimate: international coefficients applied to a representative Italian carcass. Water footprint includes green, blue and grey water and is not equivalent to the same volume of physical water withdrawal.
How to read the analysis
Observed data, model outputs and illustrative equivalents are kept separate.
Available sources show materially different footprints for beef associated with dairy herds and specialised beef herds. The values below are not a weighted Italian average.
| Indicator | Unit | Dairy herd | Specialised beef herd | Source |
|---|---|---|---|---|
| Climate change | kg CO₂eq/kg carcass | 18.4 | 67.8 | FAO GLEAM 2013 |
| Land use | m²·year/kg | 43.2 | 326.2 | Poore & Nemecek 2018 |
| Total water footprint | L/kg | 15,415 — species average | Mekonnen & Hoekstra 2012 | |
Applied to the representative Ismea carcass, these coefficients correspond to about 25.0 t CO₂eq, 12.0 ha·year and 5.7 million litres of water footprint for the specialised beef animal. These are MapTheFood calculations, not measurements from one Italian farm.
How large is one animal’s footprint?
Three visual translations of the same representative animal. The scientific indicator remains primary; the images only make the order of magnitude easier to perceive.
≈209,000 km in an average new car
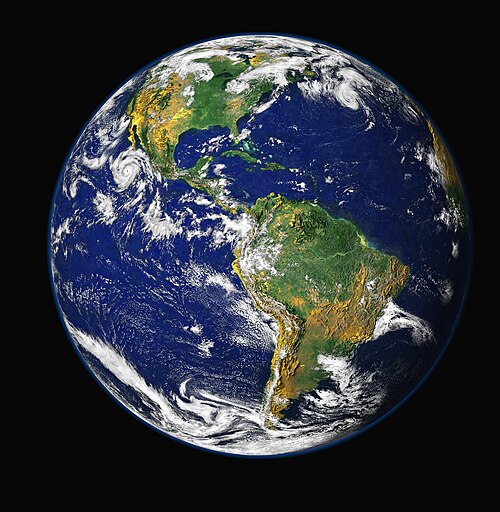
25 t CO₂eq correspond, as a climate-scale comparison, to the direct emissions of roughly 209,000 km driven by an average new car registered in Italy in 2023.
This compares climate-equivalent quantities; it does not mean livestock production emits the same physical mix of pollutants as a car.
≈17 football pitches used for one year
What does “ha·year” mean? It adds the land required across the production cycle — pasture and farmland used to grow forage and feed — and expresses that use on a common one-year basis. A hectare-year (ha·year) measures land use by combining area and duration. For example, using 6 hectares for two years equals 12 ha·year. This does not mean that 12 hectares are occupied at the same time: it is a cumulative measure of land use over time. For beef production, it includes land associated with the animal-production system within the study boundary, for example pasture and land used to produce feed. It does not mean one animal physically occupies 12 hectares at the same time.
≈38,000 bathtubs of 150 litres
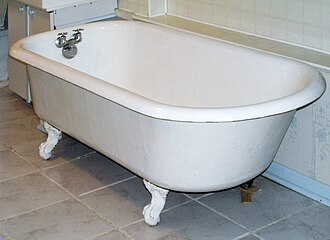
5.7 million litres are equivalent, in volume only, to roughly 38,000 bathtubs of 150 litres. The water footprint is not all withdrawn water: about 93.5% is green water, rainfall used by crops; 3.6% is blue water withdrawn from water resources; 2.9% is grey water.
The bathtub comparison is only intended to convey volume; it does not mean 5.7 million litres are withdrawn from water mains, rivers or groundwater.
The same footprint at different scales
Live weight, carcass and boneless retail-equivalent meat are distinct quantities.
* 369 kg × OECD-FAO 67% carcass-to-boneless-retail factor. This does not mean one animal yields 1,648 hamburgers.
Where imported feed commodities come from
Commercial origins differ sharply by commodity and are therefore shown separately.
In 2025, Brazil accounted for 50.4% of Italian soybean imports and the United States for 29.4%; Argentina accounted for 75.8% of soybean-meal imports. Maize imports were split between EU-27 partners (55.0%) and extra-EU origins, led by Ukraine (32.8% of the Italian total). These are national trade flows, not cattle-specific feed flows.
Interpretation boundary: Attributing these flows to beef requires a separate step not contained in customs data: import → feed use → cattle share → kg of beef.
Limits and open questions
The per-kg coefficients are international averages, not direct Italian measurements. They are used as reference values pending a fully parameterised Italian model.
Trade flows are quantified but not species-specific. COMEXT does not identify how much imported soybean, meal or maize is ultimately fed to cattle.
No weighted Italian beef average is yet available. It requires the relative contribution of specialised beef systems, dairy-derived beef and imports.
Everyday equivalents are scale illustrations. They do not add precision to the underlying footprint coefficients.